
2025 Student Achievement Data
Data Highlights
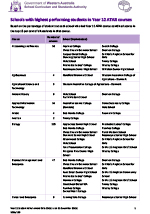
Schools with highest performing students in Year 12 ATAR courses
To be entered in this table, schools must have at least 10 students with a Year 12 ATAR course combined score in the course. The Year 12 ATAR course listings do not include schools where fewer than 10 per cent of the students had combined scores in the top 15 per cent of all students in that course.
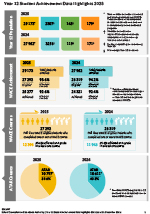
Student Achievement Data by School
(Data is as at 31 December of each year)
| Number | % | Number | % | |
|---|---|---|---|---|
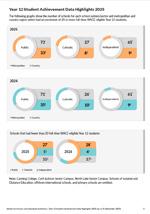
| Full-time WACE-eligible Year 12 students | ||||
| Full-time WACE-eligible Year 12 students who achieved the WACE | ||||
| Full-time WACE-eligible Year 12 students who completed four or more Year 12 ATAR courses | ||||
| Full-time WACE-eligible Year 12 students who completed a Certificate II or higher but less than four or more Year 12 ATAR courses | ||||
| Full-time WACE-eligible Year 12 students who completed four or more Year 12 ATAR courses or a Certificate II or higher | ||||
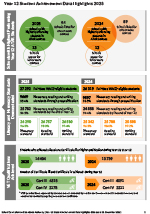
| Number of Certificate I completed in Year 10 - Year 12 by full-time WACE-eligible Year 12 students. Percentage refers to the total number of certificates issued. |
||||
| Number of Certificate II completed in Year 10 - Year 12 by full-time WACE-eligible Year 12 students. Percentage refers to the total number of certificates issued. |
||||
| Number of Certificate III or higher completed in Year 10 - Year 12 by full-time WACE-eligible Year 12 students. Percentage refers to the total number of certificates issued. |
||||
| Numeracy Achievement | ||||
| Prequalified in Year 9 NAPLAN* | ||||
| Increase (demonstrated standard in OLNA in Years 10, 11 or 12) | ||||
| Demonstrated the standard by the end of Year 12 | ||||
| Reading Achievement | ||||
| Prequalified in Year 9 NAPLAN* | ||||
| Increase (demonstrated standard in OLNA in Years 10, 11 or 12) | ||||
| Demonstrated the standard by the end of Year 12 | ||||
| Writing Achievement | ||||
| Prequalified in Year 9 NAPLAN† | ||||
| Increase (demonstrated standard in OLNA in Years 10, 11 or 12) | ||||
| Demonstrated the standard by the end of Year 12 | ||||
◆Schools with fewer than 20 full-time WACE-eligible Year 12 students are displayed from 2023. In previous years, these students were not displayed.
*Year 12 students in 2023 did not have an opportunity to prequalify through Year 9 NAPLAN in 2020 due to the cancellation of NAPLAN that year.
†Year 12 students in 2023 did not have an opportunity to prequalify through Year 9 NAPLAN in 2020 due to the cancellation of NAPLAN that year. Students who achieved Band 8 or above in Year 7 NAPLAN Writing (2018) were deemed to have prequalified.
Note: schools with an inaugural Year 12 cohort in 2025 will typically appear at the end of the list of schools.